When comparing the business drivers of both Uber and Lyft, two things stand out: Uber’s scale and its international reach (40% of revenues). Uber operates in 57 countries already.
But elsewhere they look very similar. Of-course to make any comparison we have to make assumptions around a) mix of pool rides being similar (as they are counted as separate trips/rides), and b) UberEats rides are not really that big as a share of total and don’t skew things much (its share of net revenue is ~5%; booking share 20%).
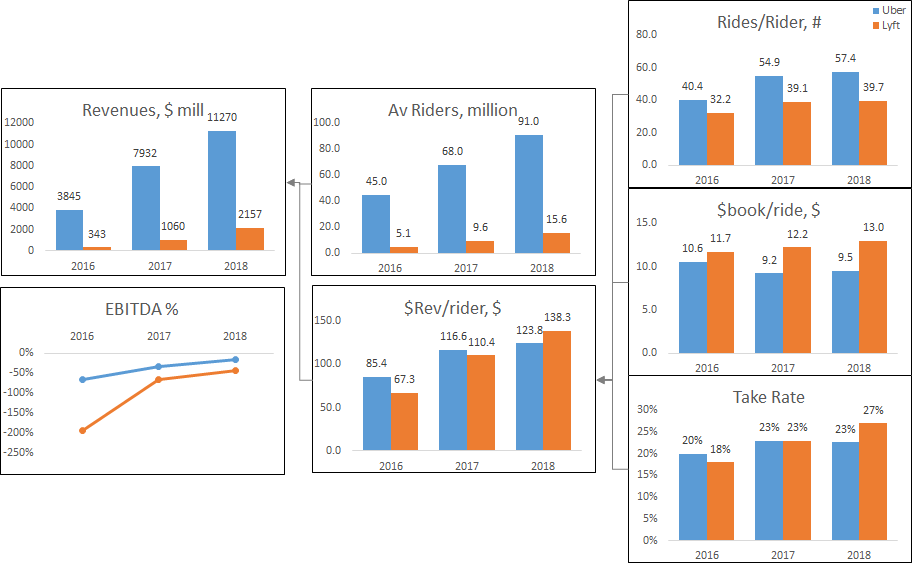
Ride-sharing businesses have relatively straight forward drivers here on: user growth and usage growth. Other inputs seem to be running at a level not leaving much room for growth. A take rate of 20-27% is already quite rich. And an average ride of ~$10 sounds very reasonable. Ofcourse, its worth nothing that this averages shared and single rides.
User growth is likely to continue for a long time, but its costly.
Software subscription business or businesses with repeat customer purchases, and in this case Uber and Lyft, spend cash upfront on sales & marketing to acquire new customers with the hope of keeping them over multiple years. In my estimate both Uber and Lyft spend ~20 months worth of gross profit on acquiring a new customer (in line with most such business assuming decent retention). This explains their very high Sales & marketing spending (28%, 37% of sales). Growing number of users is very costly!
Usage growth from existing customers is what funds new user growth.
Subscription businesses fund this costly growth of acquiring new customers by increasing the share of wallet of existing customers.
With respect to usage, I note two things from Uber and Lyft’s S-1 disclosures:
- Uber users use it more often, ~50% more. There are two potential explanations for that – either Uber has a higher share of shared rides, or there is greater usage of ride-sharing outside of North America.
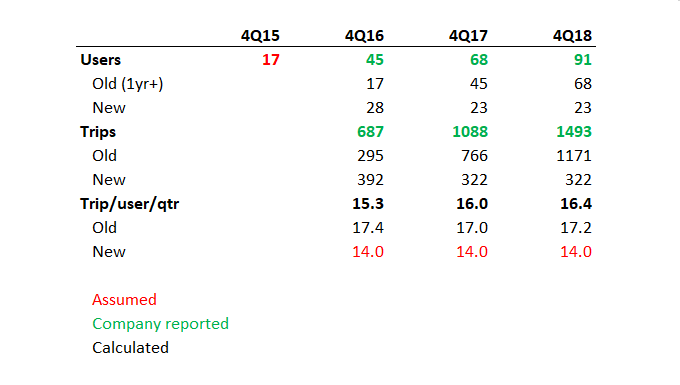
- Usage per rider seems to be flat-lining for now. This is not good news, especially given there is potentially a TAM for 400 rides per rider (5 days a week * 40 weeks * 2x a day) rides every year. For some, this might mean that there is a huge TAM, as both Lyft and Uber would also suggest, and we are only 10-15% penetrated. Or something less benign …
The issue for ride-sharing is that usage and thus wallet share of existing users appears to be plateauing. Perhaps this is because the next best alternative for transportation, i.e. public transport, is still cheaper compared to ride-hailing. In London, a tube journey costs ~£2.8 one way, and a pool easily 2x more and takes longer. And a pool is not really more convenient versus public transport when you have to walk to designated pickup locations.
What next? A tricky trade-off
Fully self driven cars will drastically reduce costs for ride-hailing services and likely lead to demand elasticity and open up the S-curve for further usage penetration gains. But robo-taxis, with no drivers, even by most optimistic estimates are at least 5-10 years away.
This leaves a tricky trade-off at the hands of these businesses:
- Driving usage growth would require price declines and would mean expanding losses. With already cash-consuming user growth, this will require more capital – likely debt raise.
- Accepting flat-lining usage growth means driving growth solely through growing users. This would lead to growth slowing down faster than what many expect.
Over the next 3-5 years, these businesses will need to choose between profitability and growth, and will likely require more capital. Something I think might happen earlier than what many expect.
This is not investment advice.